Wykresy
Menu główne:
Pakiet lattice
Pakiet lattice zawiera wiele rozszerzeń funkcji dostępnych w pakiecie graphics.
####################################################################
################ Wybrane wykresy pakietu lattice ###################
####################################################################
### Wybrane funkcje pakietu lattice
#Histogram
histogram(~ Sepal.Length | factor(Species), data = iris)
#Wykres słupkowy - wykres dla zbioru Titanic
barchart(Class ~ Freq | Sex + Age, data = as.data.frame(Titanic),groups = Survived, stack = TRUE, layout = c(4,
1),auto.key = list(title = "Survived", columns = 2))
barchart(Class ~ Freq | Sex + Age, data = as.data.frame(Titanic),groups = Survived, stack = TRUE, layout = c(4, 1),
auto.key = list(title = "Survived", columns = 2),scales = list(x = "free"))
# Estymacja funkcji gęstości
densityplot(rnorm(4))
densityplot(rnorm(10))
densityplot(rnorm(100))
# Box plot
bwplot(factor(Petal.Width) ~ Sepal.Length | Species, data = iris)
# Wykresy dla tablic wielodzielczych
dotplot(VADeaths)
dotplot(VADeaths, groups = FALSE)
dotplot(VADeaths, groups = FALSE,layout = c(1, 4), aspect = 0.7,origin = 0, type = c("p", "h"),
main = "Wskaźniki zgonów Virginia - 1940",xlab = "Rate (per 1000)")
dotplot(VADeaths, type = "o",auto.key = list(lines = TRUE, space = "right"),
main = "Wskaźniki zgonów Virginia - 1940",xlab = "Rate (per 1000)")
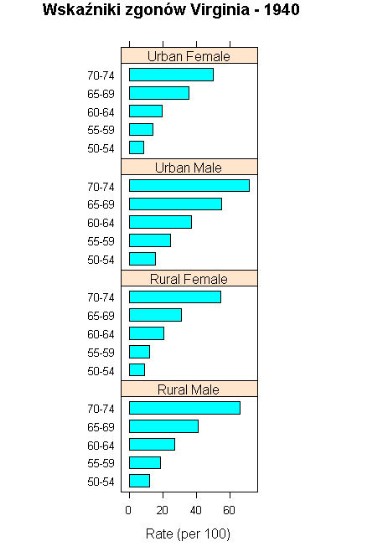
barchart(VADeaths, groups = FALSE,layout = c(1, 4), aspect = 0.7, reference = FALSE,
main = "Wskaźniki zgonów Virginia - 1940",xlab = "Rate (per 100)")
# Transformacja Box-Cox (animacja)
boxcox.trans <- function(x, lambda) {if (lambda == 0) log(x) else (x^lambda - 1) / lambda}
for (p in seq(0, 3, by = 0.5)) \par