Bibliografia
Chang W. (2021) R Graphics Cookbook
Granjon D. (2021) Outstanding User Interfaces with Shiny
Healy K. (2018) Data Visualization. A Practical Guide.
Murrell P. (2005)R Graphics , John Wiley plik
Wickham H. (2009 ) ggplot2: Elegant Graphics for Data Analysis.
Wilke C.O. ( 2019) Fundamentals of Data Visualization.
Aigner W., Miksch S., Schumann H., Tominski, C. (2011). Visualization of Time-Oriented Data. Springer London. https://doi.org/10.1007/978-0-85729-079-3
Albert J., Rizzo M. (2012) R by Example. Springer Science+Business Media. New York.
Aldrich J. O., Rodriguez, H. M. (2013). Building SPSS graphs to under-stand data. SAGE Publications.
Biecek P. (2014) Odkrywać! Ujawniać! Objaśniać!: zbiór esejów o sztuce prezentowania danych. Fundacja Naukowa SmarterPoland.pl. Warszawa.
Biecek P., Baranowska E., Sobczyk P. (2019) Wykresy unplugged. Fun-dacja Naukowa SmarterPoland.pl. Warszawa.
Chen C., Hardle W., Unwin A. (2008) Handbook of Data Visualization, Springer-Verlag, Berlin.
Cleveland W. S. (1993). Visualizing Data. Hobart Press.
Cirillo A. (2016). RStudio for R. Statistical Computing Cookbook. Packt Publishing. Livery Place.
Czempas J. (2000). Elementy statystyki. Podstawowe mierniki i metody. Wyższa Szkoła Biznesu W Dąbrowie Górniczej. Wydawnictwo Triada. Dąbrowa Górnicza.
Domański Cz., Pruska K., Wagner W. (1998). Wnioskowanie statystyczne przy nieklasycznych założeniach. Wydawnictwo Uniwersytetu Łódzkiego, Łódź.
Fisher D., Meyer M. (2018). Making Data Visual. A Practical Guide to Using Visualization for Insight. O’Reilly. Sebastopol.
Friendly M. (1994). Mosaic displays for multi-way contingency tables, Journal of the American Statistical Association, 89:190–200.
Friendly M. (2000). Visualizing Categorical Data, SAS Institute Inc., Cary.
Kassambara A. (2013). ggplot2: Guide to create beautiful graphics in R (Second edition). STHDA.
Kabacoff R.I. (2015). R in Action. Data Analysis and Graphics with R. Manning Publications Co., New York.
Kirk A. (2019). Data visualisation: A handbook for data driven design (2nd edition). SAGE.
Knaflic C. N. (2015). Storytelling with data: A data visualization guide for business professionals. Wiley.
Kocimowski K., Kwiatek J. (red) (1976). Wykresy i mapy statystyczne. Główny Urząd Statystyczny. Warszawa.
Kończak G. (2012). Wprowadzenie do symulacji komputerowych. Wy-dawnictwo Uniwersytetu Ekonomicznego w Katowicach.
Kończak G. (2016). Testy permutacyjne. Teoria i zastosowania. Wydaw-nictwo Uniwersytetu Ekonomicznego w Katowicach.
Kończak G. (2020). Nieklasyczne metody statystyczne w badaniach eko-nomicznych. Wydawnictwo Uniwersytetu Ekonomicznego w Katowicach.
Kopczewska K., Kopczewski T., Wójcik P. (2009). Metody ilościowe w R. Aplikacje ekonomiczne i finansowe, CeDeWu.PL Wydawnic-twa Fachowe, Warszawa.
Long J. D., Teetor P. (2019). R Cookbook. Proven Recipes for Data Analysis, Statistics and Graphics. O’Reilly Media. Sebastopol.
Moulik T. (2018). Applied Data Visualization with R and ggplot2. Packt Publishing. Birmingham.
Pimpler E. (2017). Data Visualization and Exploration with R. A practical guide to using R, RStudio, and tidyverse for data visualization, exploration, and data science applications. GeoSpatial Training Services. Boerne.
Playfair W. (2005). Playfair’s Commercial and Political Atlas and Statistical Breviary, Cambridge, London.
Rahlf T. (2017). Data Visualization with R. 100 Examples. Springer In-ternational Publishing. Cham.
Rao C. R. (1994). Statystyka i prawda. Wydawnictwo Naukowe PWN Warszawa. Reichmann W. J. (1968). Drogi i bezdroża statystyki. Państwowe Wydawnictwo Naukowe. Warszawa.
Rendgen S. (2018). The Minard System. The Complete Statistical Graphics of Charles-Joseph Minard. Princetown Architectural Press. New York.
Sobczyk M. (2001). Statystyka. Wydawnictwo Naukowe PWN. Warszawa.
Sosulski K. (2019). Data visualization made simple: Insights into becoming visual. Routledge, Taylor & Francis Group.
Steele J., & Iliinsky N. P. N. (red.) (2010). Beautiful visualization: Look-ing at data through the eyes of experts. O’Reilly.
Toit S. H. C. ., Steyn, A. G. W., Stumpf, R. H. (1986). Graphical Explor-atory Data Analysis. Springer International Publishing. New York.
Tufte E. R. (1983). The Visual Display of Quantitative Information, Cheshire. CT: Graphics Press.
Tufte, E. R. (2006). Beautiful evidence. Graphics Press.
Tufte E. R. (red.) (2013). Envisioning information (14. print). Graphics Press.
Tufte E. R. (2019). Visual explanations: Images and quantities, evidence and narrative (Twelfth printing, April 2019). Graphics Press.
Tukey J. W. (1977). Exploratory Data Analysis. Addison-Wesley.
Unwin A. (2015). Graphical Data Analysis with R. A CRC Press Taylor & Francis Group. Boca Raton.
Unwin A., Theus M., Hofmann H. (2006). Graphics of Large Datasets. Visualizing a Million, Springer Science+Business Media, Inc. New York.
Walesiak M., Gatnar E. (red.) (2009). Statystyczna analiza danych z wykorzystaniem programu R, Wydawnictwa naukowe PWN, Warszawa.
Wawrzynek J. (2007). Metody opisu i wnioskowania statystycznego. Wydawnictwo Akademii Ekonomicznej we Wrocławiu.
Wills G. (2012). Visualizing Time. Springer New York. https://doi.org/10.1007/978-0-387-77907-2.
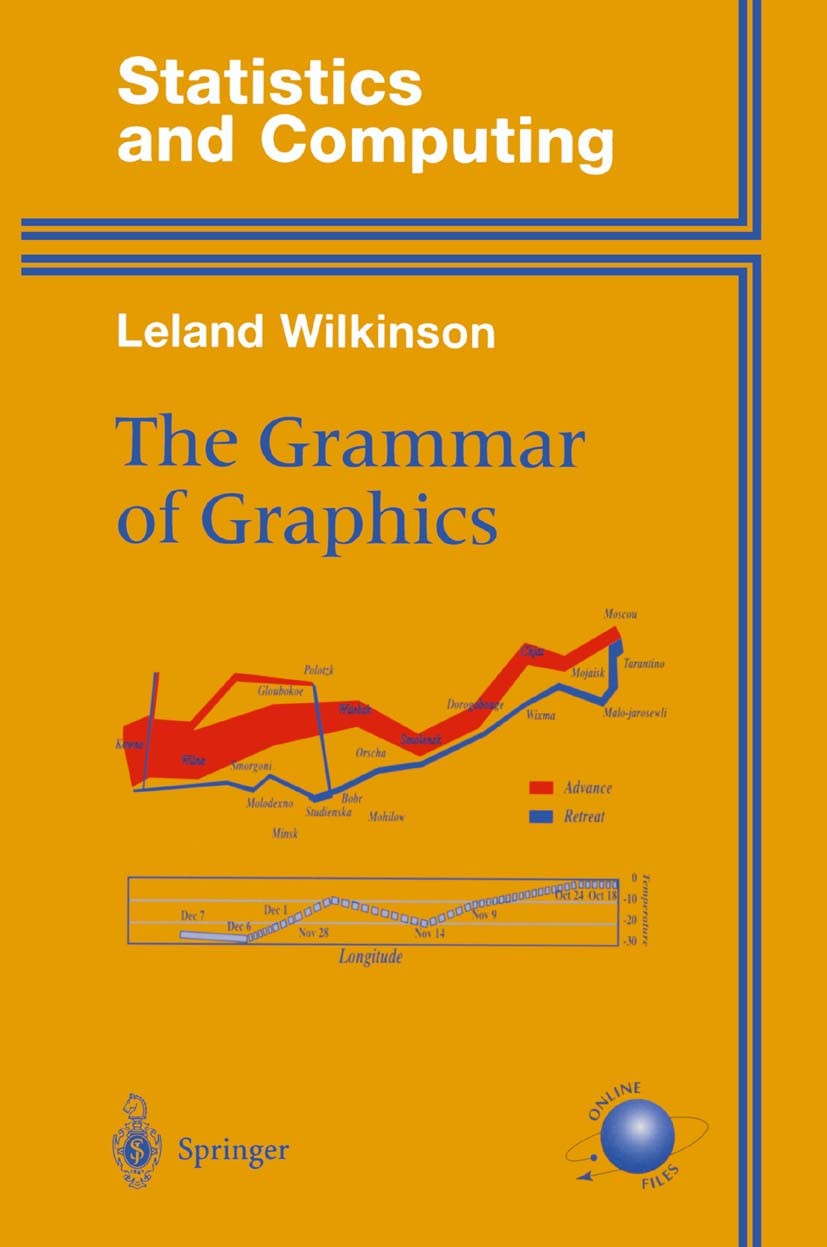
Wilkinson L. (2005). The Grammar of Graphics, Springer Science+Business Media, Inc. New York.
Zelazny G. (2005). Say it with charts workbook. McGraw-Hill.
Cleveland W. S., McGill R. (1987) Graphical Perception: The Visual Decoding of Quantitative Information on Graphical Displays of Data. Journal of the Royal Statistical Society. Series A (General), 150(3), 192. https://doi.org/10.2307/2981473
Friendly M. (1994). Mosaic displays for multi-way contingency tables, Journal of the American Statistical Association, 89:190–200.
Friendly M. (2005). Milestones in the history of data visualization: A case study in statistical historiography, in C. Weihs and W.Gaul (eds), Classification: The Ubiquitous Chal lenge, Springer, New York, pp. 34–52.
Friendly M. (2008). Milestones in the history of thematic cartography, statistical graphics, and data visualization. pp 13–14. Retrieved 7 July 2008.
Henderson H. V., Velleman P. F. (1981). Building multiple regression models interactively. Biometrics, 37, 391–411
Ihaka R., Gentleman R. (1996). R: A Language for Data Analysis and Graphics. Journal of Computational and Graphical Statistics, 5(3), 299–314. https://doi.org/10.2307/1390807
Inselberg A. (1999). Don’t panic . . . do it in parallel, Computational Statistics 14(1):53–77.
Kończak G. (2014). Rola graficznych prezentacji danych w popularyzacji statystyki, Wiadomości Statystyczne, Nr 7, Tom LIX, s. 49 – 61.
Kończak G., Kosińska M. (2023). O testowaniu istotności różnic w strukturach populacji na podstawie prób o małych liczebnościach. Zeszyty Naukowe Uniwersytetu Ekonomicznego w Krakowie, nr 3 (1001), str. 145-160. https://doi.org/10.15678/ZNUEK.2023.1001.0308.
Kończak G., Żądło T. (2010). Potrzeby przedsiębiorstw w zakresie analiz statystycznych i możliwości ich realizacji z wykorzystaniem arku-sza kalkulacyjnego Excel, [w:] Nauczanie przedmiotów ilościowych a potrzeby rynku pracy http://www.ie.uni.lodz.pl/artykuly str. 149 - 159.
Żądło T., Kończak G. (2009). Analizy statystyczne i graficzna prezentacja danych wykorzystaniem programu R w nauczaniu statystyki, [w:] Rola informatyki w naukach ekonomicznych i społecznych. Innowacje i implikacje dyscyplinarne. 2/2009 tom 2, str. 353 – 361. Wyższa Szkoła Handlowa w Kielcach.
aplpack (2024) https://cran.r-project.org/web/packages/aplpack/index.html (12.02.2024)
Awesome_ggplot2 (2023) https://github.com/erikgahner/awesome-ggplot2. (27.07.2023).
Carte Figurative (2023) https://www.martingrandjean.ch/wp-content/uploads/2014/05/Minard1Vector.png (15.07.2023)
Carte Figurative2 (2023) http://cartographia.files.wordpress.com/2008/05/minard_napoleon.png (17.02.2024)
Causes of Mortality (2023) https://www.historyofinformation.com/image.php?id=851 (15.07.2023).
Charles Minard (2024) http://www.datavis.ca/gallery/minbib.php (22.03.2024)
Cholera (2023) https://upload.wikimedia.org/wikipedia/commons/2/27/Snow-cholera-map-1.jpg (15.07.2023)
Coxcomb (2024) http://datavis.ca/milestones//admin/uploads/images/coxcomb3.jpg (17.02.2024)
CRAN (2024), http://www.r-project.org (2.04.2024).
DataViz Project (2023) https://datavizproject.com (22.07.2023)
Datanovia (2024) https://www.datanovia.com/en/blog/top-r-color-palettes-to-know-for-great-data-visualization/ (12.02.2024)
First Weather Map (2023) https://www.datavis.ca/milestones/index.php?group=1600s#lightbox-gallery-49-2 (15.07.2023).
FlowingData (2023) https://flowingdata.com/category/visualization/statistical-visualization/ (27.07.2023).
ggplot2Extensions (2023) https://exts.ggplot2.tidyverse.org/gallery/. (27.07.2023).
Gapminder (2024) https://www.gapminder.org/ (12.02.2024)
Heliocentryzm (2024) https://pl.wikipedia.org/wiki/Heliocentryzm (17.02.2024)
Hieroglify (2024) https://pl.wikipedia.org/wiki/Egipskie_hieroglify_%E2%80%93_okre%C5%9Blniki_i_ideogramy (22.03.2024)
JPowered (2024) https://jpowered.com/graphs-and-charts/bar-chart-history.html (7.02.2024)
Malarstwo jaskiniowe (2024) https://pl.wikipedia.org/wiki/Malarstwo_jaskiniowe (22.03.2024)
Marey (2024) http://marlenacompton.com/?p=103 (22.03.2024)
Milestones (2024) http://datavis.ca/milestones/ (22.03.2024)
Milestones Project (2023) https://www.datavis.ca (22.07.2023)
Milestones Timeline (2024) https://datavis.ca/milestones/ (17.02.2024)
Paletteer Gallery (2024) https://pmassicotte.github.io/paletteer_gallery/ (16.02.2024)
Playfair Charts (2023) https://friendly.github.io/HistDataVis/ch05-playfair.html (15.07.2023).
Planetary Movements Map (2023) http://www.fi.uu.nl/wiskrant/artikelen/hist_grafieken/begin/images/planeten.gif (15.07.2023).
Ptolemy’s World Map (2023) https://pl.wikipedia.org/wiki/Mapa_Ptolemeusza#/media/Plik:Ptolemy_Asia_detail.jpg (15.07.2023).
Portal Statystyczny (2023) https://portalstatystyczny.pl/ (22.07.2023)
R-charts (2023) https://r-charts.com/. (22.07.2023)
RColorBrewer (2023) https://cran.r project.org/web/packages/RColorBrewer/index.html (05.05.2023)
RStudio (2024) https://www.rstudio.com/ (17.02.2024)
The Oldest Map (2023) http://datavis.ca/milestones/uploads/images/oldest-map.jpg (22.07.2023).
The Oldest Map opis (2024) http://www.atamanhotel.com/catalhoyuk/oldest-map.html (22.03.2024)
Types of Chart (2023) https://pro.arcgis.com/en/pro-app/latest/help/analysis/geoprocessing/charts/types-of-charts.htm (29.07.2023)
wesanderson (2023) https://cran.r project.org/web/packages/wesanderson/wesanderson.pdf (05.05.2024)
Wikimedia (2024) https://upload.wikimedia.org/wikipedia/commons/d/da/Ibry%27s_Visual_Train_Schedule.png (15.02.2024)
Weather Map (2024) https://www.datavis.ca/milestones/index.php?group=1600s&mid=ms49 (22.03.2024)
World Map (2023) https://datavis.ca/milestones/uploads/images/worldmap.gif (17.02.2024)
 |
 |
 |
 |
 |
 |
 |
 |
 |
 |
 |
 |
 |
 |
 |
 |
 |
 |
 |
 |
 |
 |
 |
 |