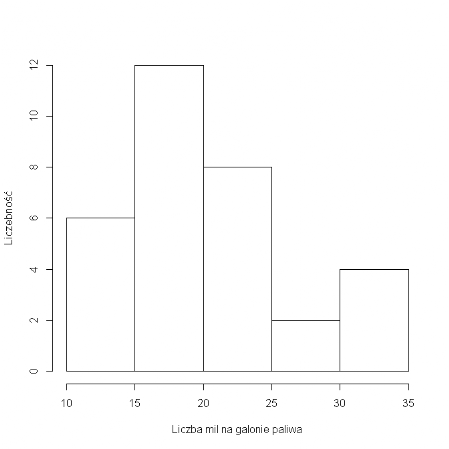
#Kod 1.4. Konstrukcja histogramu – zmienna mpg
attach(mtcars)
hist(mpg,main='',xlab='Liczba mil na galonie paliwa', ylab='Liczebność')

############################################################################
### Dodatki ###
############################################################################
#
hist(mtcars$mpg)
#
hist(mtcars$mpg, col=2)
#
hist(mtcars$mpg,col=2, breaks=12)
# źródło: https://www.statmethods.net/graphs/density.html
# Add a Normal Curve (Thanks to Peter Dalgaard)
x <- mtcars$mpg
h<-hist(x, breaks=10, col="red", xlab="Miles Per Gallon",main="Histogram with Normal Curve")
xfit<-seq(min(x),max(x),length=40)
yfit<-dnorm(xfit,mean=mean(x),sd=sd(x))
yfit <- yfit*diff(h$mids[1:2])*length(x)
lines(xfit, yfit, col="blue", lwd=2)