Wykresy
Menu główne:
Inne
### Inne wykresy
Różne inne wykresy.
W tej częsci podano przykłady wykresów:
- skrzynkowego (pudłkowego),
- łodyga-liść,
- punktowego.

####################################################################
###################### Inne wybrane wykresy ########################
####################################################################
### Inne wybrane wykresy
# Wykres skrzynkowy
boxplot(rchisq(100,2),col=3)
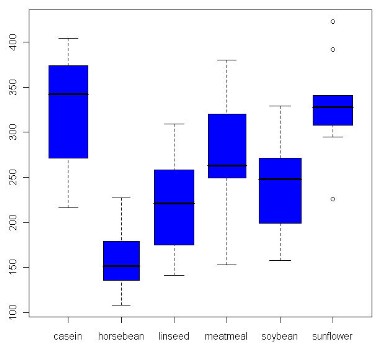
boxplot(weight~feed,col=4)
boxplot(weight~feed,col=4,varwidth=TRUE)
# Wykres łodyga liść
stem(weight)
### jak wyżej po zlogarytmowaniu danych
stem(log(weight))
###Wykres punktowy
dotchart(t(VADeaths), xlim = c(0,100), main = "Death Rates in Virginia")
### Wykres trójwymiarowej powierzchni
x <- seq(-10, 10, length= 30)
y <- x
f <- function(x,y) { r <- sqrt(x^2+y^2); sin(2*r)/r }
z <- outer(x, y, f)
z[is.na(z)] <- 1
op <- par(bg = "white")
persp(x, y, z, theta = 30, phi = 30, expand = 0.5, col = "red")
### Estymacjafunkcji gęstości
densityplot(~ iris$Sepal.Width | factor(Species), data = iris,plot.points = FALSE, ref = TRUE)
densityplot(~ weight | factor(feed), data = chickwts,plot.points = FALSE, col="red",ref = TRUE)